Charting Completed and Missing Work
Authors:Author: Jessica Gribbon, Neuse River Middle School, Wake County Public School System
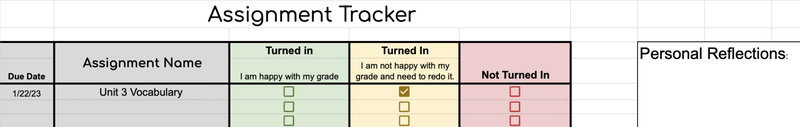
We believe we will see a change in student grades and performance when they are given a tool to track work completion. Students were given a spreadsheet with all of the assignments for the quarter. They had three options to choose from for each assignment:
1) Completed
2) Completed but Would Like to Make Revisions
3) Incomplete.
-
Research Base
Improver: Jessica Gribbon, Neuse River Middle School, Wake County Public School System
-
Impact
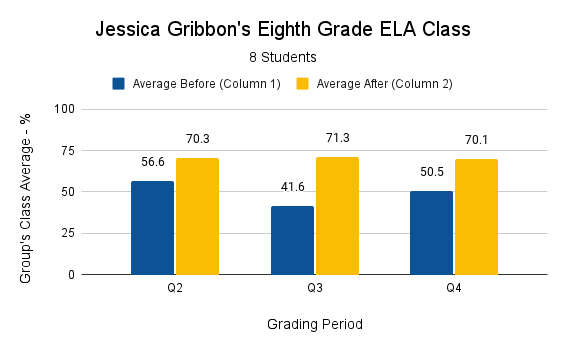
Of the eight students measured in my 8th grade ELA class last year, all eight improved their overall grades. All eight turned in one or more missing assignments. Five of the eight who were previously failing improved to passing grades.
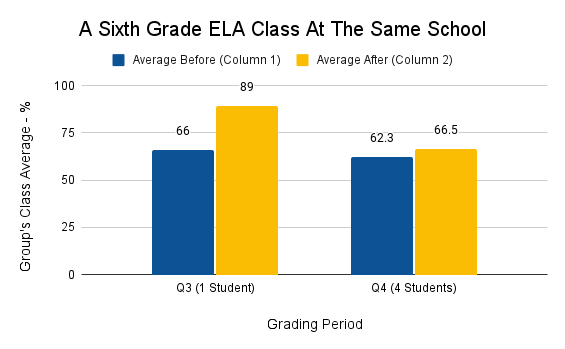
A sixth grade ELA class at the same school tested the idea with a small group of students. The class average increased after introducing the tracker.
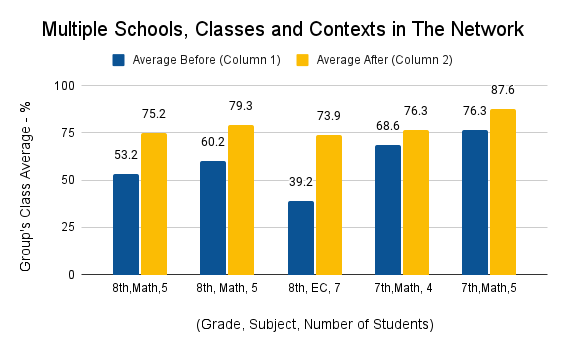
This idea has subsequently been tested by multiple teachers across middle school content area and grade level and has led to reliable improvement across contexts. One-hundred percent of the classes that tried this improvement idea reported an increase in the class average of students in the test group.
-
Practical Keys to Success
I was very mindful of how the checklist was presented to students. I didn’t want them to think of it as another assignment or expectation. I was very clear in highlighting this as a tool that would make things easier on them.
A lot of students have been struggling with the cohort system and focusing at home and many have said the checklist helped them quickly locate missing assignments and/or assignments they performed poorly on.
Many students did not have missing work and loved being able to validate that to me as well as their parents. They then received the rest of the class period to work on assignments from their other classes outside of the Google Meet, a very much appreciated break!
-
Measurement
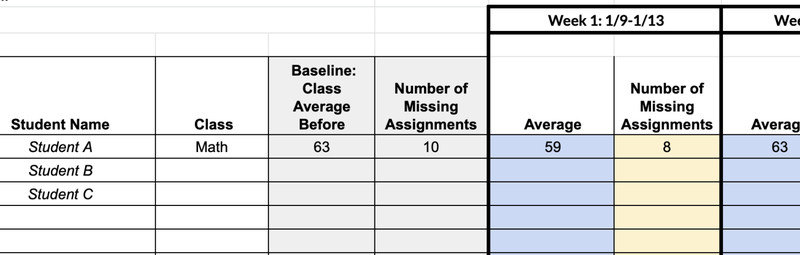
Collect baseline data for the number of missing assignments and the class average for the students in the test group. Record the changes in the number of missing assignments and overall class average to measure improvement.
Email us at Schools That Lead to request a sample data collection spreadsheet and student missing assignment tracker.